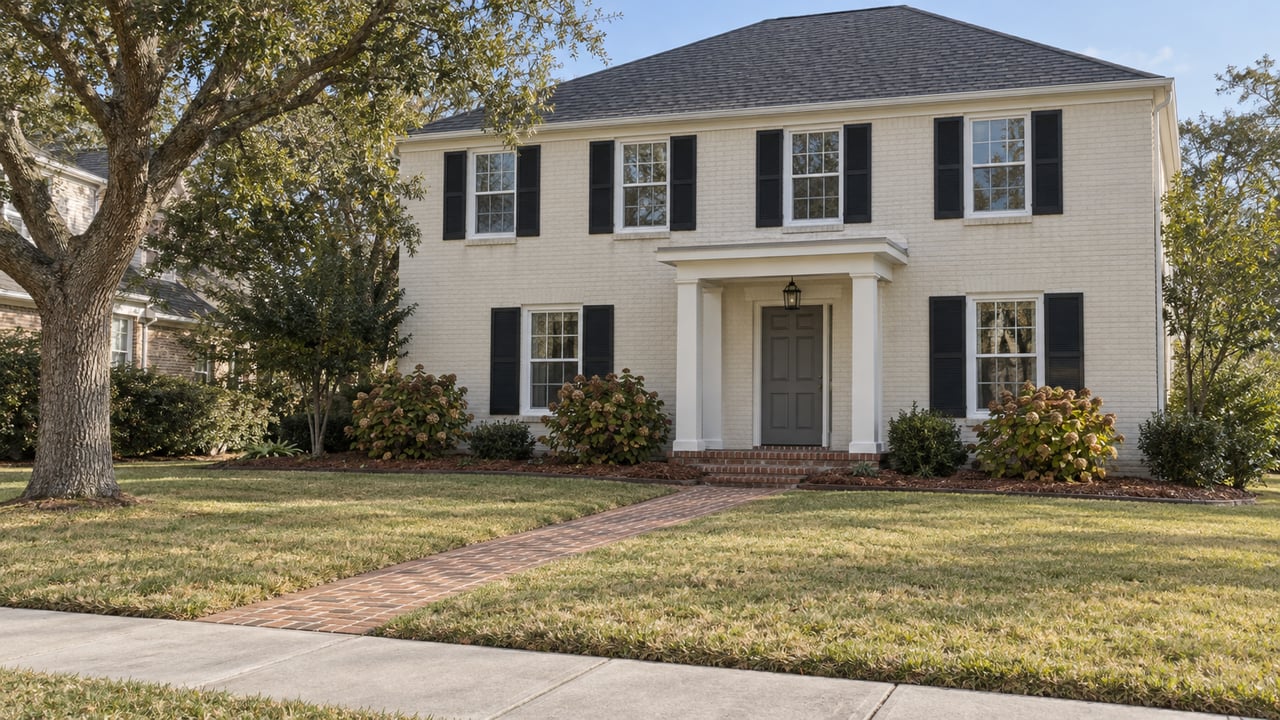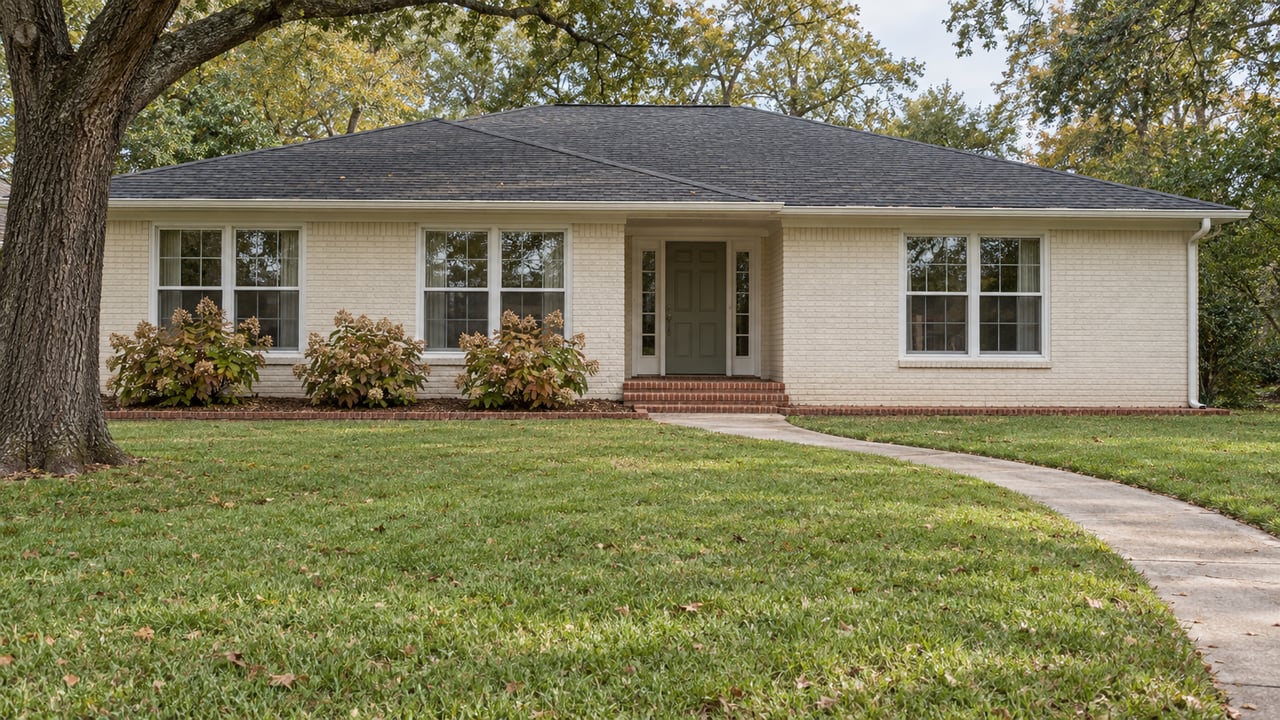
Thinking about buying or selling in Tallahassee and wondering what the market is doing right now? You are not alone. With seasonality, mortgage rates, and university cycles in play, it can be hard to read the signals. In this guide, you will learn the key indicators to watch, how to interpret them for Leon County, and what they mean for your next move. Let’s dive in.
Tallahassee housing signals to track
Inventory and months of inventory
Inventory is the number of homes for sale at any moment. Pair it with months of inventory, which is active listings divided by the pace of monthly closed sales. The thresholds matter: below 4 months typically favors sellers, 4 to 6 months is balanced, and above 6 months leans toward buyers. You can find county-level inventory and months of supply in the Florida Realtors market reports for Leon County, which are updated monthly and widely used by local pros. See the latest data on the Florida Realtors research hub under county profiles.
- Tip: Confirm today’s reading against the same month last year to avoid seasonality traps.
Prices and price per square foot
Median sale price shows the midpoint of what sold, which helps you track direction over time. Price per square foot helps you compare across neighborhoods and home sizes. If median price rises while price per square foot is flat, it may be a mix shift toward larger or higher-end homes rather than broad price appreciation. For broader context on price trends at the state and national level, the Federal Housing Finance Agency’s house price index offers a reliable benchmark for long-run direction.
- Tip: Use 12-month rolling medians for a cleaner trend and fewer false alarms.
Days on market and negotiation pressure
Days on market tells you how fast homes go under contract. When DOM falls and months of inventory is under 4, sellers usually gain leverage. The sale-to-list price ratio helps, too. Readings near 98 to 100 percent suggest buyers are paying close to asking, while lower ratios point to more room to negotiate.
- Tip: Watch for a rising DOM trend paired with more price reductions. That often signals a shift toward a more balanced market.
New listings vs. closed sales momentum
New listings show fresh supply while closed sales show demand that actually finished. If new listings rise faster than closed sales for several months, inventory can build and cool price pressure. If closed sales outpace new listings, active supply can tighten.
- Tip: Pair this with the pending-to-new-listings ratio to see where demand is heading next month.
Mortgage rates and affordability
Mortgage rates directly affect what buyers can afford. Even a small rate change can alter monthly payments enough to influence demand. For the latest weekly rate trend, check the Freddie Mac Primary Mortgage Market Survey, which is considered a national standard for rate tracking. Use a simple what-if: compare payment at today’s rate against a plausible lower rate and weigh that against recent price momentum.
- Resource: Review the current trend on the Freddie Mac PMMS page for a quick affordability gut check.
Local forces shaping Tallahassee now
State government stability
Tallahassee’s role as Florida’s capital provides a steady base of public sector employment. That stability tends to dampen wild swings and supports consistent housing demand compared with many fast-cycling Sun Belt metros. When agencies expand or freeze hiring, you will often see it reflected in sales counts and rental demand within a few months.
University cycle drives rentals
FSU, FAMU, and Tallahassee Community College generate strong student and staff demand, especially near campus. Expect a seasonal listing and leasing wave heading into late spring and early summer. Investor activity in campus-adjacent neighborhoods often follows the academic calendar more than the traditional buying season.
New construction and permits
Future supply shows up first in building permits. Tracking single-family and multi-family permits helps you see what may hit the market in 6 to 24 months. For broader permit trends, review the U.S. Census Building Permits Survey. Local permit portals in the City and County can add project-level detail on timing and location.
- Resource: Check the U.S. Census Building Permits Survey for monthly and annual permit counts.
Jobs and population headlines
Employment and population flow influence long-run housing demand. The Bureau of Labor Statistics provides local unemployment and labor force trends, while the U.S. Census publishes population estimates and household characteristics. A strengthening job market can pull DOM lower and keep sale-to-list ratios firm.
- Resource: Look up the Tallahassee area on BLS Local Area Unemployment Statistics and population profiles on data.census.gov.
What it means for you
If you are selling
- If months of inventory is under 4 and DOM is stable or falling, price confidently near recent comps and be ready for strong early activity.
- If the market sits between 4 and 6 months, focus on presentation and pricing precision. Small list-price adjustments can speed up time to contract.
- If supply trends toward 6 months or more, plan for longer marketing windows, discuss targeted price strategies, and consider buyer incentives.
Pro move: Align your list date with local seasonality. Spring often brings more buyers, and near-campus neighborhoods can behave differently around the academic calendar.
If you are buying
- Track months of inventory and sale-to-list ratios in your target neighborhoods. Higher MOI and lower sale-to-list readings often translate to more negotiation room.
- Compare your monthly payment at today’s rate with a realistic lower-rate scenario using current national averages from the Freddie Mac PMMS. If prices are trending up while inventory is tight, waiting for a rate drop could cost more than you save.
- Get pre-approved early so you can act fast if DOM is short and competition is high.
If you are investing
- Focus on rent growth, vacancy, and the academic calendar. Student turnover peaks around summer, which can create brief leasing windows and opportunities.
- Track permits and pipeline. A rise in multi-family permits can change vacancy dynamics 12 to 24 months out.
- Use price per square foot and renovation cost ranges to compare value-add targets across neighborhoods. Stable demand near campus and in established suburban communities can support consistent occupancy.
Neighborhood snapshots to watch
- Campus-adjacent zones near FSU and FAMU: Investor-friendly dynamics with strong rental turnover tied to the school year. Expect pronounced seasonality in listings and leasing.
- Midtown and historic districts: Often low inventory with renovation demand. Price per square foot can remain firm due to character homes and location appeal.
- Killearn and Northeast Tallahassee suburbs: Popular for single-family homes with planned-community features and access to amenities. Watch DOM and sale-to-list trends for early signs of cooling or heating.
- Western Leon County and outlying areas: Larger lots and rural options attract buyers seeking space. Inventory shifts can be more pronounced due to lower transaction counts.
Note: Always compare neighborhood trends on a 12-month rolling basis. Smaller areas can produce misleading month-to-month swings.
How to read reports without the noise
- Use 12-month rolling medians for price and DOM. This smooths out one-off spikes and holiday effects.
- Compare the latest month to the same month last year to control for seasonality.
- Pair at least three signals before you call a trend. For example, rising MOI, higher DOM, and a lower sale-to-list ratio together are more meaningful than any one metric alone.
- Check state and national context. The FHFA house price index and Freddie Mac PMMS help you separate local dynamics from national tides.
Where to find trustworthy Tallahassee data
- County-level market stats for inventory, sales, prices, and months of supply are available through Florida Realtors county reports. Start with the Florida Realtors Research and Statistics page for Leon County snapshots and trends.
- For mortgage rates, use the weekly updates from the Freddie Mac Primary Mortgage Market Survey.
- For long-run price trends, consult the Federal Housing Finance Agency house price index.
- For permits, use the U.S. Census Building Permits Survey and your local city or county permit portals for project details.
- For parcel and tax roll information, the Leon County Property Appraiser provides ownership and assessed value records.
Helpful links:
- Explore county-level market trends on the Florida Realtors research hub: Florida Realtors Research and Statistics
- See the latest mortgage rate averages: Freddie Mac Primary Mortgage Market Survey
- Review long-run price benchmarks: FHFA House Price Index
- Track building permits and pipeline: U.S. Census Building Permits Survey
- Check local labor trends: BLS Local Area Unemployment Statistics
- Explore population and housing data: U.S. Census data.census.gov
- Look up parcel and valuation info: Leon County Property Appraiser
Ready to take the next step?
If you want a clear read on your price range, time-to-sell, or the best neighborhoods for your goals, get a custom report and a plan built around your timeline. Reach out to The Tagoe Team for a local, data-informed strategy and hands-on service from the first call to closing.
FAQs
Are prices rising or falling in Tallahassee right now?
- Check the 12-month median sale price for Leon County on the Florida Realtors research page, then compare it to the prior year and pair it with months of inventory to confirm the direction.
How long will it take to sell my house in Tallahassee?
- Look up the latest median days on market for Leon County and compare it to last year; your home’s condition, pricing, and neighborhood will influence whether you sell faster or slower than the median.
Is Tallahassee a good market for rental investment?
- Focus on rent demand near universities, vacancy trends, and the permit pipeline; steady student-driven demand and moderate new supply can support occupancy when underwritten conservatively.
Should buyers wait for mortgage rates to drop in Leon County?
- Weigh the monthly payment at today’s Freddie Mac PMMS rate against a plausible lower rate and consider local price momentum; if supply is tight and prices climb, waiting can backfire.
Which Tallahassee neighborhoods are appreciating fastest?
- Use price per square foot and transaction counts by neighborhood over a 12-month window; confirm that any standout gains are not just a few higher-end sales skewing the median.
What signals show a shift toward a buyer’s market in Tallahassee?
- Watch for months of inventory moving above 6, days on market rising, and sale-to-list ratios slipping below the high-90s, especially if price reductions become more common.